Exploratory Data Analysis Dashboard

Overview
This started simply as a proof of concept for feature classification, but has the potential to be a fully-automated machine learning tool.
The idea is that, while no automation is perfect, some are helpful. By aiming to account for 80% of decisions to be correct and the remainder to be intuitively guided by the dashboard, this process can be extremely streamlined and remove a lot of the manual exploration. There are several key distinctions of this dashboard from other EDA tools. The first is NLP of the column name. While columns are not guaranteed to be named consistently, enough are to make the process valuable. The second is sorting by functional data types and not simply by data storage standards. Rather than numeric/character distinctions, data is sorted by how it is used. Free-form text is used much differently than categorical variables, despite both being character data fields. By setting thresholds on really simple parameters, a high level of accuracy can be achieved to sort columns. Once sorted, this drives the model feature engineering process.
Current State
Project Overview
Users can create a new project which will contain multiple data sets. Datasets are linked by primary-key->foreign-key connections. These start by checking for columns with the same name and then verifying content, otherwise simply by content. Users can also select their own dataset connections.

Dataset Overview
Column Names
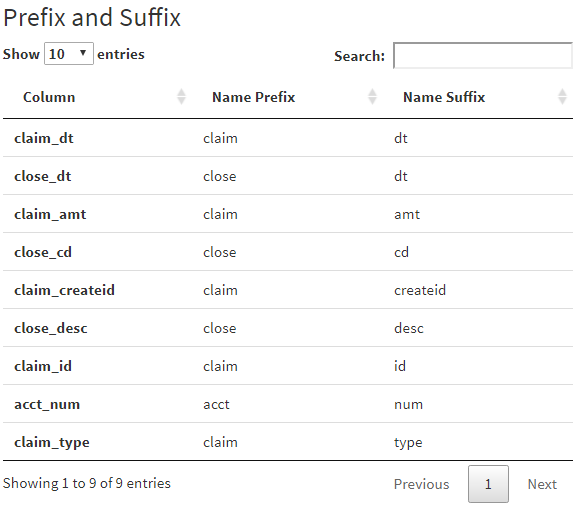
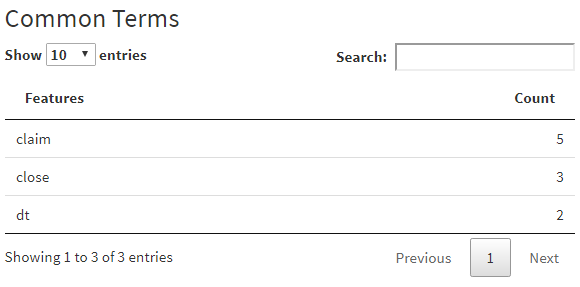
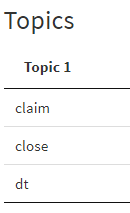
Users select the individual dataset that they want to explore. NLP parses column names in a number of ways
- Prefix/Suffix
- Common Terms
- Topic Modeling
Column Type
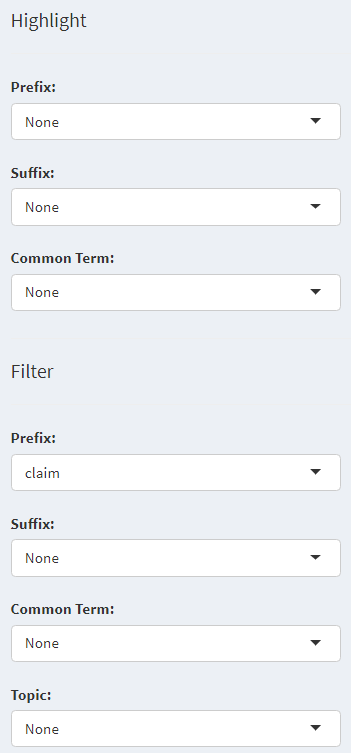
Columns are automatically sorted into a number of functional categories, with the option for users to change those classifications. Users can highlight and filter columns based on the column name data in the previous step:
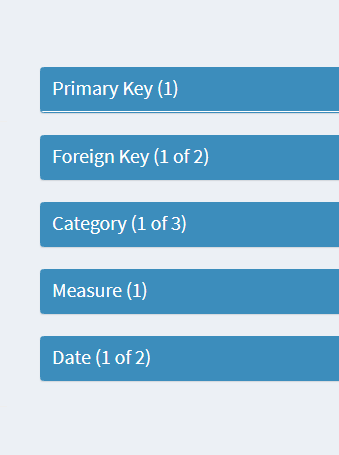
By expanding each category and selecting a column, a summary chart is provided based on the data type.
Column Network
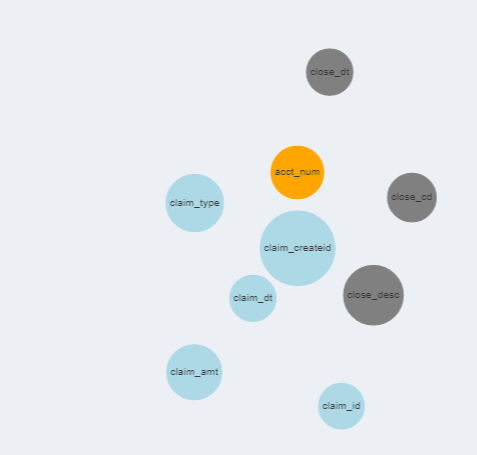
Columns can also be visualized in a network. Color and shape can be selected by prefix/suffix or by column category. Columns can also be connected by mutual population (i.e. they are only populated when the other is also populated)
Future State
The next steps are to incorporate data wrangling and column creation. There is also the opportunity to incorporate automated feature engineering. Once that is completed, users will be able to select a target variable and create models based on applicable column types.
